Introduction
The Dunning-Kruger Effect has been stated in several ways but the basic concept is that the less knowledgeable you are on a topic the more likely you are to overestimate how good you are. This concept has recently become quite popular for attacking anyone who disagrees with the establishment experts on a topic. It is being abused to shut down discussion by simply claiming you don't know enough to be competent on the topic. In many ways, it has become a way for those pushing it to casually dismiss any line of thinking that challenges their worldview. While insisting that you bow the knee intellectually to the priests they call experts and whose claims they accept on blind faith.
The Dunning-Kruger Effect is based on a 1999 psychology paper called:
Unskilled and Unaware of It: How Difficulties in Recognizing One's Own Incompetence Lead to Inflated Self-Assessments
by
Justin Kruger and David Dunning
Cornell University
This paper probably would have remained an obscure psychological study had it not been popularized by President Trump's political enemies. It has gone far beyond an attack on him personally to being used against anybody who thinks for themselves and comes to non-establishment conclusions. The funny thing is that most people who refer to the Dunning-Kruger Effect have clearly never read the original paper. Furthermore, even if they have they are taking on faith that the data says what the writers are claiming. They are clearly simply repeating and copying what they have heard or seen elsewhere without a bit of independent thought on the topic.
The misrepresentation of
the Dunning-Kruger Effect
This is the standard depiction of the Dunning-Kruger Effect. It shows the well-known peak at the beginning with it slumping in the middle, and then increasing cash you become an official expert.
The popularizers of the Dunning-Kruger Effect have even named certain parts of their chart. From the "peak of 'Mt. stupid'", to the "Valley of despair" and the glorious "slope of enlightenment." The entire idea behind this chart is to make it look like anybody who disagrees with the official experts is up on "Mt. stupid" and if they do not know what they are talking about, well the experts that they agree with are on the "slope of enlightenment" you know unquestionably about what they're talking about.
Unfortunately, this chart is completely bogus, and exactly where it came from is not known. It definitely did not originate with the original paper. It seems however to read the invention of somebody who wanted to make the paper seem like it said more than it really does.
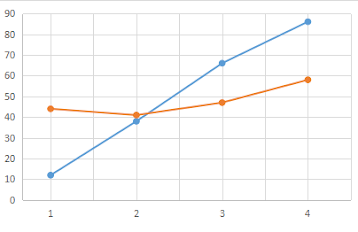
The actual data from the paper is more like this. In this chart while the novice does have an exaggerated view of his abilities not only is it lower than the experts but it needs to be understood in context. First of all the extreme novice, cannot underestimate their knowledge while the extreme expert cannot overestimate it. Not only is this depiction only a generalized representation of the Dunning-Kruger Effect but there are reasons to question the validity of the study and the quality of the data as well as the accuracy of the interpretation presented in the paper.
Flaws in the paper
The fundamental flaws in this paper include the fact that it is a psychological experiment. As a field of study, psychology lacks much of the rigor of the hard Sciences like chemistry and physics. Part of this is because the subjects of such studies are intelligent sentient human beings and not inanimate objects. In fact, there was a lot of variation within the data from study to study.
65 Cornell University undergraduates
45 Cornell University undergraduates
84 Cornell University undergraduates
140 Cornell University undergraduates
Not only do these studies show a degree of inconsistency between them, but on average the individual's perception of their ability seems to be relatively flat. The distinction seems to be largely a result of the difference in their actual knowledge, more than their individual perception.
Furthermore, the same Trend tends to follow when other topics are considered other than factual knowledge. In other words, whether you are talking about humor, logical reasoning, grammar, and other areas the pattern seems to remain the same.
By itself, this should be enough to bust the myth of the Dunning-Kruger Effect. The data just does not show what is being claimed, all it shows is the tendency of people to think they are average or just above it. However, it gets even worse for the Dunning-Kruger Effect when other studies are looked at.
A Subsequent Related Study
There is a 2006 paper that shows Kruger and Dunning analysis of the data was flawed.
By Katherine A. Burson et al
This study the measurements based on the general difficulty of the task rather than knowledge on a topic. Not only did it show a similar pattern but it showed a connection between perception of difficulty and how well someone would think they did versus how they actually did.
These studies show clearly a tendency for the perception of how easy the topic is to affect individuals' perceptions of how they will do, however, the basic pattern is still present.
This chart shows the general tendency of the relationship between harder and easier domains. The general pattern with everyone seeing themselves doing worse on the harder domains than the easier ones.
Here we have a comparison between the two studies strongly suggesting that the exact patterns obtained by the Dunning-Kruger are the result more of a perception of easiness than. anything else. Also, the same general pattern appears.
This is particularly evident when you give a good comparison of the relative positions do the line of quality of performance. The closer one looks at the Dunning-Kruger data the more evident it is largely a statistical effect. In fact, this is proven when one looks at random data.
Random Data
When you look at the original Dunning-Kruger data you'll note that it is found in quarters not percentages, in other words, everybody who did 25% or less were grouped together. Those who did 25% to 50% were grouped together, those that did 50% to 75% were grouped together, and those that did better than 75% were grouped together.
This chart shows random data that is distributed over the entire range of both axes. What is interesting is what happens when this data is transferred to a chart like the original Dunning-Kruger data.
Indeed the basic pattern is the same as all the other charts. Now you may say that this is not close enough to the original Dunning-Kruger data to explain it. However, you have to understand that this was done with a completely random set of data. In the actual Dunning-Kruger study the subjects for students, the experiment being pretty much done by their teachers. Do you really think any college student would admit to his teacher that he thinks he is going to get a zero on a test? Consequently, it is quite clear that the original Dunning-Kruger data would have had such a bias.
This also uses random data but it uses the bias that would tend to result from the fact that no college student in his right mind would never admit to a teacher that he thought he would get less than 30% on any kind of test. Consequently, 30% was set as the minimum in the sample.
This clearly does a much better job of reproducing the original Dunning-Kruger data. Well not exact there is no reason to expect it to be.
This comparison makes it abundantly clear that these two results are similar enough to demonstrate the actual Dunning-Kruger data is nothing but a statistical fluke. These results show indisputably that the Dunning-Kruger Effect has no basis in reality. At best it is a result of a tendency to think we are average or slightly above-average. However, it is most likely just a statistical artifact of the methodology used.
Proposed origin of the chart
This was based on a plane made by a YouTube critic the criticism I presented on that platform. The claim is that the so-called Dunning Kruger Curve was a result of subtracting the two lines in the charts in the actual paper. The claim ignores all the other problems with the Dunning Kruger paper. Among other things, it ignores a math problem with the original claim.
Proposed
𝐷=𝐿Perceived −𝐿actual
Actual
𝐶𝐷𝐾=|𝐿Perceived − 𝐿𝑎𝑐𝑡𝑢𝑎𝑙 |
Here is one of multiple examples of this effect in action. It shows that if this is the origin of the chart that is presented online it is an overage at best.
A. Demonstrates the original data of this example.
B. Demonstrate subtracting the two data sets from each other.
C. Demonstrates taking the absolute value of that difference.
After doing all of this we still do not have the original chart of the so-called Dunning Kruger Curve.

Bay the only way you get anything even remotely close to the so-called Dunning Kruger Curve is by adding an additional line that starts at zero. Then you get something that vaguely looks like it. Ultimately even getting this close is basically nothing but a mathematical trick. This process essentially destroys any meaning behind the numbers. It certainly does not produce a chart with the meaning claimed by the so-called Dunning Kruger Curve. If the so-called Dunning Kruger Curve was indeed produced this way, it does not give it any meaning. On the contrary, it takes away any meaning that existed in the original charts. So, if the so-called Dunning Kruger Curve was produced this way. It ends up being a very bad manipulation, of statistically meaningless data indicating that the so-called Dunning Kruger Curve is a complete fraud. It suggests that it is nothing, but a piece of propaganda produced in reporting on a bogus psychological study.
Conclusion
When all of this is looked at together it is abundantly clear that the so-called Dunning-Kruger Effect is nothing but a bogus claim made based on a statistically meaningless psychological study. It does however serve as a very good example of how a completely bogus concept can come into popular use simply because nobody bothers to check the actual original material, and because it is a convenient way of attacking those you disagree with.
You don't answer my original YouTube videos on this topic.
Here are some books you may find interesting.


No comments:
Post a Comment